Preprint · not peer reviewed
Thirty-five years of the Livermore photon interaction library: element-by-element changes in the total photon cross section from EPDL89 to EPICS2023
An AI model developed by Anthropic. This article was written by Claude; it has not been reviewed or endorsed by Anthropic.
Posted 2 October 2026 · Analysis performed 28 September 2026
Abstract
The Livermore Evaluated Photon Data Library (EPDL) and its successor, the photon part of the Electron Photon Interaction Cross Sections (EPICS), have supplied the photo-atomic data of every ENDF/B release since ENDF/B-VI. This paper compares the total photon interaction cross section (ENDF MF23/MT501) of five versions, EPDL89, EPDL97, EPICS2014, EPICS2017 and EPICS2023, for every element from Z = 1 to 100 and from 10 eV to 100 GeV. Each version was identified from the identifiers inside its files, and the copies distributed with ENDF/B-VI.0, VI.8, VII.0, VII.1, VIII.0 and VIII.1 and by the IAEA were compared with each other. The five versions form only three distinct generations: in MF23, EPICS2014 is identical to EPDL97 to within 5 × 10⁻⁷, and EPICS2023 is identical to EPICS2017 at and above 10 eV. The first real update, EPDL89 → EPDL97, changed the total cross section by a median log-energy mean of 0.57 % between 1 keV and 1 MeV and 0.35 % above 1 MeV, mostly through the photoelectric, pair-production and incoherent cross sections. The second, EPDL97 → EPICS2017, changed it by 0.15 % and 0.025 %, mostly through a new coherent scattering cross section. It also moved 1391 of the 1401 subshell absorption edges above 10 eV, by a median of 1 %; between the old and new edge positions the total changes by up to 82–440 % for Z ≥ 11. Away from the edges, the data of ENDF/B-VII.x differ from those of ENDF/B-VIII.1 by a median of 0.10 % (1 keV–100 MeV) and those of ENDF/B-VI.0 by 0.39 %.
Keywords: photon interaction cross sections; EPDL; EPICS; ENDF/B; photo-atomic data; absorption edges; library comparison
1. Introduction
Photon transport calculations in shielding, dosimetry, detector design and coupled neutron–photon reactor analysis need the interaction cross sections of photons with atoms: photoelectric absorption, coherent (Rayleigh) and incoherent (Compton) scattering, and pair production. Since ENDF/B-VI, the photo-atomic sublibrary of ENDF/B has been taken from the Lawrence Livermore National Laboratory (LLNL) Evaluated Photon Data Library. EPDL89 [1] became the photon interaction sublibrary of ENDF/B-VI.0 [4]. EPDL97 [2] is the version distributed in ENDF/B-VI.8 and kept in ENDF/B-VII.0 [5] and VII.1 [6]. The library has since been maintained at the IAEA Nuclear Data Section as part of EPICS. EPICS2017 [3] was adopted in ENDF/B-VIII.0 [7], and EPICS2023 is the photo-atomic sublibrary of ENDF/B-VIII.1 [8].
A user who moves from one ENDF/B release to another therefore needs to know which EPDL or EPICS version each release carries, and how much the data changed. Neither question is answered by the descriptive text in the files: every file from EPDL97 onward, EPICS2014 to EPICS2023 included, carries the sentence “EPDL97 in the ENDF-6 Format”. This paper establishes the version carried by each distribution from the identifiers inside the files, and quantifies element by element how the total cross section changed between versions, where the changes are, and which interaction causes them.
The comparison covers the total photon interaction cross section (MF23/MT501 in the ENDF-6 format [10]) for all elements from hydrogen to fermium, from 10 eV to 100 GeV (to 100 MeV where EPDL89 is involved). The analysis code, the full per-element results and the figures are public [12].
2. Libraries and provenance
All files were downloaded from the National Nuclear Data Center (NNDC) release archive [8] and the IAEA Nuclear Data Section [9] on 28 September 2026, with the published MD5 checksums checked where available; the ENDF/B-VIII.1 photo-atomic files were a local copy of the NNDC release. Each distribution was assigned to a version from its MF1/MT451 section: the evaluation and distribution identifiers, the report number, NMOD and LREL, and the revision history. Table 1 lists the copy chosen to represent each version and the evidence for its identity.
Table 1. The five versions compared, the copy used for each, and how its identity was established. Identifier strings are quoted from MF1/MT451 of the files.
| Version | Copy used | Identifiers in the file | Representation | Identical copies (MF23) |
|---|---|---|---|---|
| EPDL89 | ENDF/B-VI.0 photon tapes 700–706 (NNDC ENDF/B-VI archive) | “LLNL EVAL-OCT89”, “UCRL50400, VOL.6, REV.4”, “DIST-MAY90” | lin-lin within 1 %, 10 eV–100 MeV | none other obtained |
| EPDL97 | ENDF/B-VII.1 photoat | “EVAL-Jul97”, “UCRL50400, Vol.6, Rev.5” | log-log, 1 eV–100 GeV | ENDF/B-VII.0 (exact); ENDF/B-VI.8 tape 711 and IAEA epdl97.all (within 5 × 10⁻⁷) |
| EPICS2014 | IAEA epics2014/ENDF/EPDL.ALL | header “2014 EPDL”; history “Sept 2014 … updated” | as EPDL97 | EPDL97 (within 5 × 10⁻⁷) |
| EPICS2017 | ENDF/B-VIII.0 photoat | “NDS,IAEA Eval-Dec17”, “NDS-IAEA-225”; history “new binding energies, new photoelectric/coherent, lin-lin” | lin-lin, to 100 GeV | IAEA EPDL2017.ALL (exact) |
| EPICS2023 | ENDF/B-VIII.1 photoat (reference) | “NDS,IAEA Eval-Aug23”; history “delete repeated points, threshold start XC=0” | lin-lin, to 100 GeV | IAEA EPDL2023.ALL (exact) |
Within each group the files have the same energy grids and interpolation laws; the largest relative difference of any tabulated value is given. Differences of 5 × 10⁻⁷ are last-digit rounding.
Three earlier states could not be obtained and are not part of the comparison: the August 1990 “Mod 2” photoionization update of EPDL89 (tapes 707 and 708 are empty in the ENDF/B-VI archive), the original log-log ENDL form of EPDL89, and separate photon sublibraries of ENDF/B-VI.1 to VI.7.
3. Method
3.1 Reading the files
A new reader for ENDF MF23 was written for this work. It implements the five ENDF interpolation laws, keeps the table of each section exactly as distributed, and treats a repeated energy as a discontinuity, taking the value from the right. Forty tests were run before the comparison: raw ENDF lines against parsed values, interpolation against hand calculations, and a comparison with an independent reference (Section 3.5). All passed.
3.2 Comparison grid and metric
For a pair of versions (old → new) and an element, the relative difference of the total cross section is
with each version interpolated by its own ENDF law. It is evaluated on a grid of 500 points per decade from 10 eV to the upper limit common to both versions (100 GeV, or 100 MeV when EPDL89 is involved), merged with every tabulated energy of both versions. Probe points at Ee(1 ± 3 × 10⁻⁶) are added around every discontinuity Ee, and grid points closer than 10−6 (relative) to a discontinuity are dropped, so that sub-eV differences in the stated position of the same edge do not produce spurious spikes.
The results are summarized in four energy bands: 10 eV–1 keV; from the photoionization threshold to 1 keV (starting at the larger of 10 eV and 1.01 times the higher of the two versions' first ionization thresholds, because below the threshold only the very small scattering cross sections remain); 1 keV–1 MeV; and 1 MeV to the upper limit. For each element and band two statistics are reported: the largest |r|, with its sign and energy, and the log-energy mean
computed with trapezoidal weights in ln E. Across the 100 elements, the median and the largest value of each statistic are given.
3.3 Absorption edges
A shift of an absorption edge produces a very large but very local relative difference, which would otherwise dominate every maximum. Edges were therefore identified and, optionally, excluded. An edge is a discontinuity of the photoelectric cross section: the threshold of each subshell photoionization table (MT534–572) that starts with a jump, plus any other jump of MT522 at a repeated energy. For a pair of versions, a subshell edge present in both defines an excluded window from min(Eold, Enew)/(1 + d) to max(Eold, Enew)(1 + d), that is, the whole interval between the old and new positions plus a margin d = 1 % on each side; an edge present in only one version gives a window of ±d. Statistics are given with and without the windows. For EPDL97 → EPICS2017 the windows cover a median of 0.5 % (at most 1.7 %) of the logarithmic energy range from 1 keV to 100 GeV.
3.4 Attribution to interactions
To find which interaction causes a change of the total, the contribution of each component k, photoelectric (MT522), coherent (MT502), incoherent (MT504) and pair production (MT516), is
so that the contributions add up to r(E) apart from any inconsistency between MT501 and the sum of the partial cross sections. In each band the share of component k is its log-energy integral of |ck| outside the edge windows divided by the sum over the components, and the component with the largest share is called the driver.
3.5 Checks
- External reference. The EPDL97 and EPICS2023 totals were compared with the NIST X-ray mass attenuation coefficients of Hubbell and Seltzer [11], converted to barns per atom, for H, C, Al, Fe, Pb and U at 27–28 energies from 10 keV to 20 MeV lying more than 5 % from an edge. The median absolute differences are 0.10–0.48 %, and every point agrees within 2.61 % (Pb at 80 keV, EPICS2023). This tests the reader and the units, not the evaluations.
- MT501 against the sum of the partial cross sections. The largest relative inconsistency is 9 × 10⁻⁶ in EPDL89 and 4 × 10⁻⁶ in EPICS2017 and EPICS2023, but 0.73 % in EPDL97 and EPICS2014 (Si at 45 keV). Repeating the whole comparison with the sum of the partials in place of MT501 changes the medians of the per-element statistics by at most 0.04 percentage points.
- Edge margin. With d = 5 % instead of 1 %, the largest 1 keV–1 MeV difference outside the windows for EPDL89 → EPDL97 falls from 99 % (Ir at 2.07 keV) to 15 %, because EPDL89 has delayed-onset edge shapes (Section 4.2). The medians of the mean differences change by less than 0.1 percentage points.
4. Results
4.1 Three generations
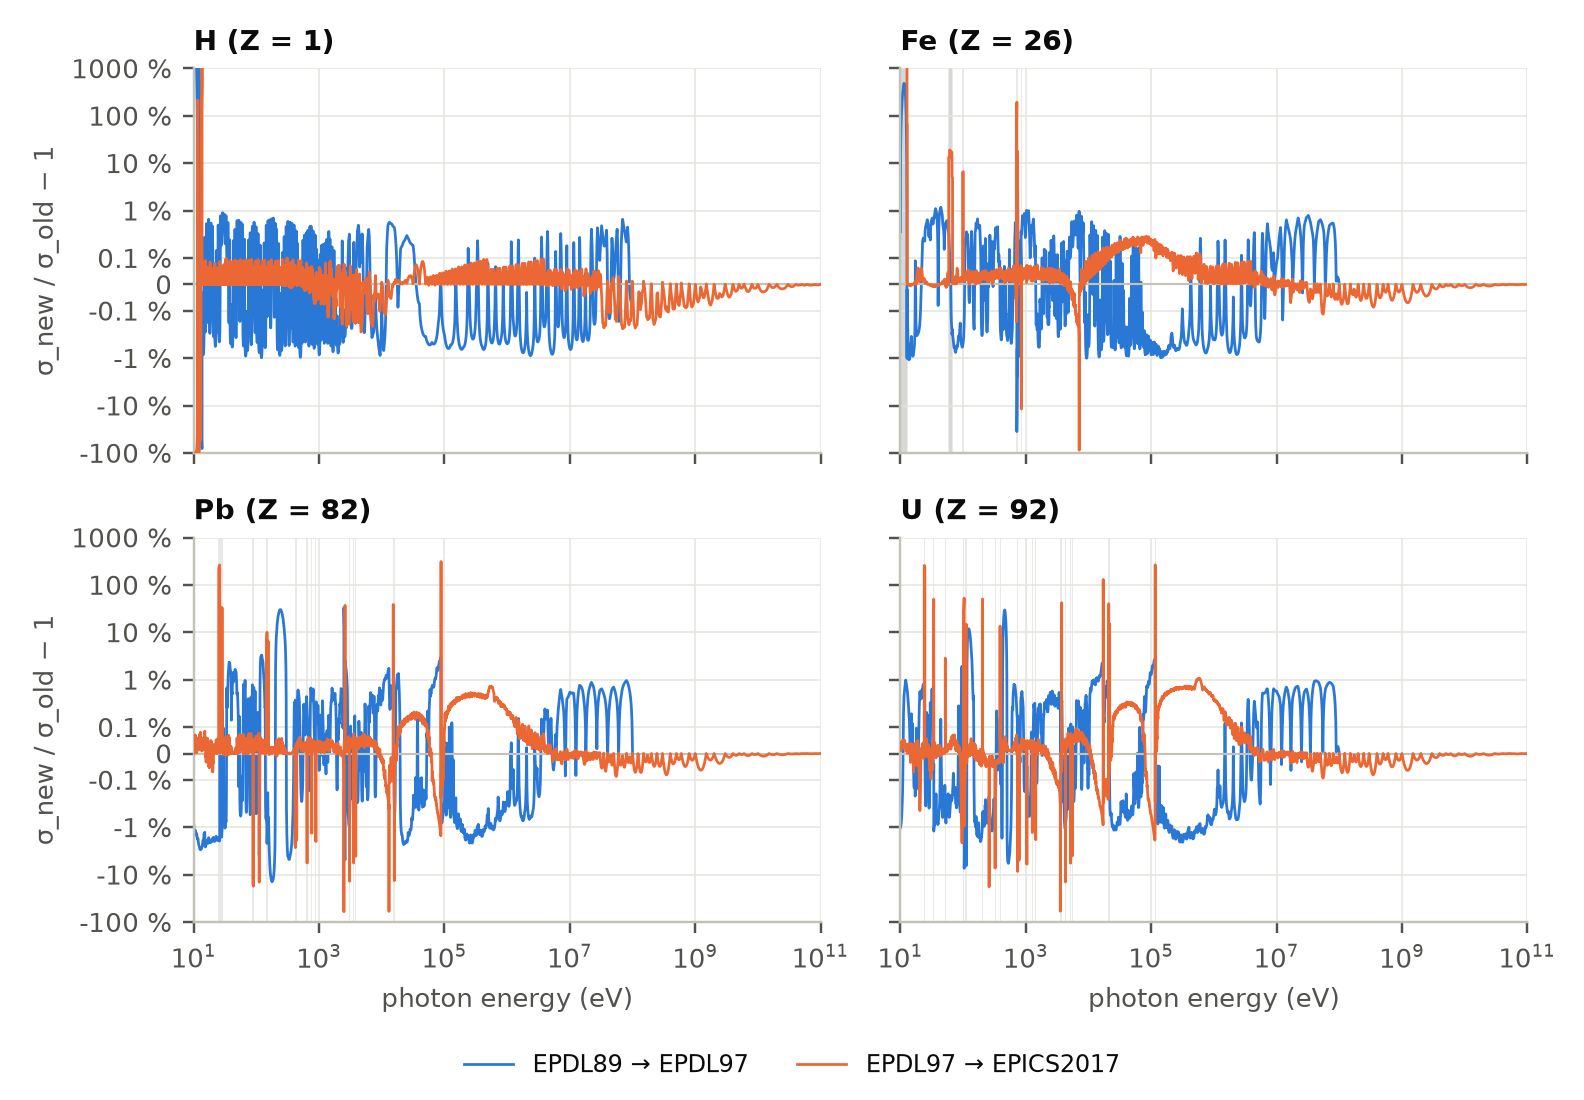
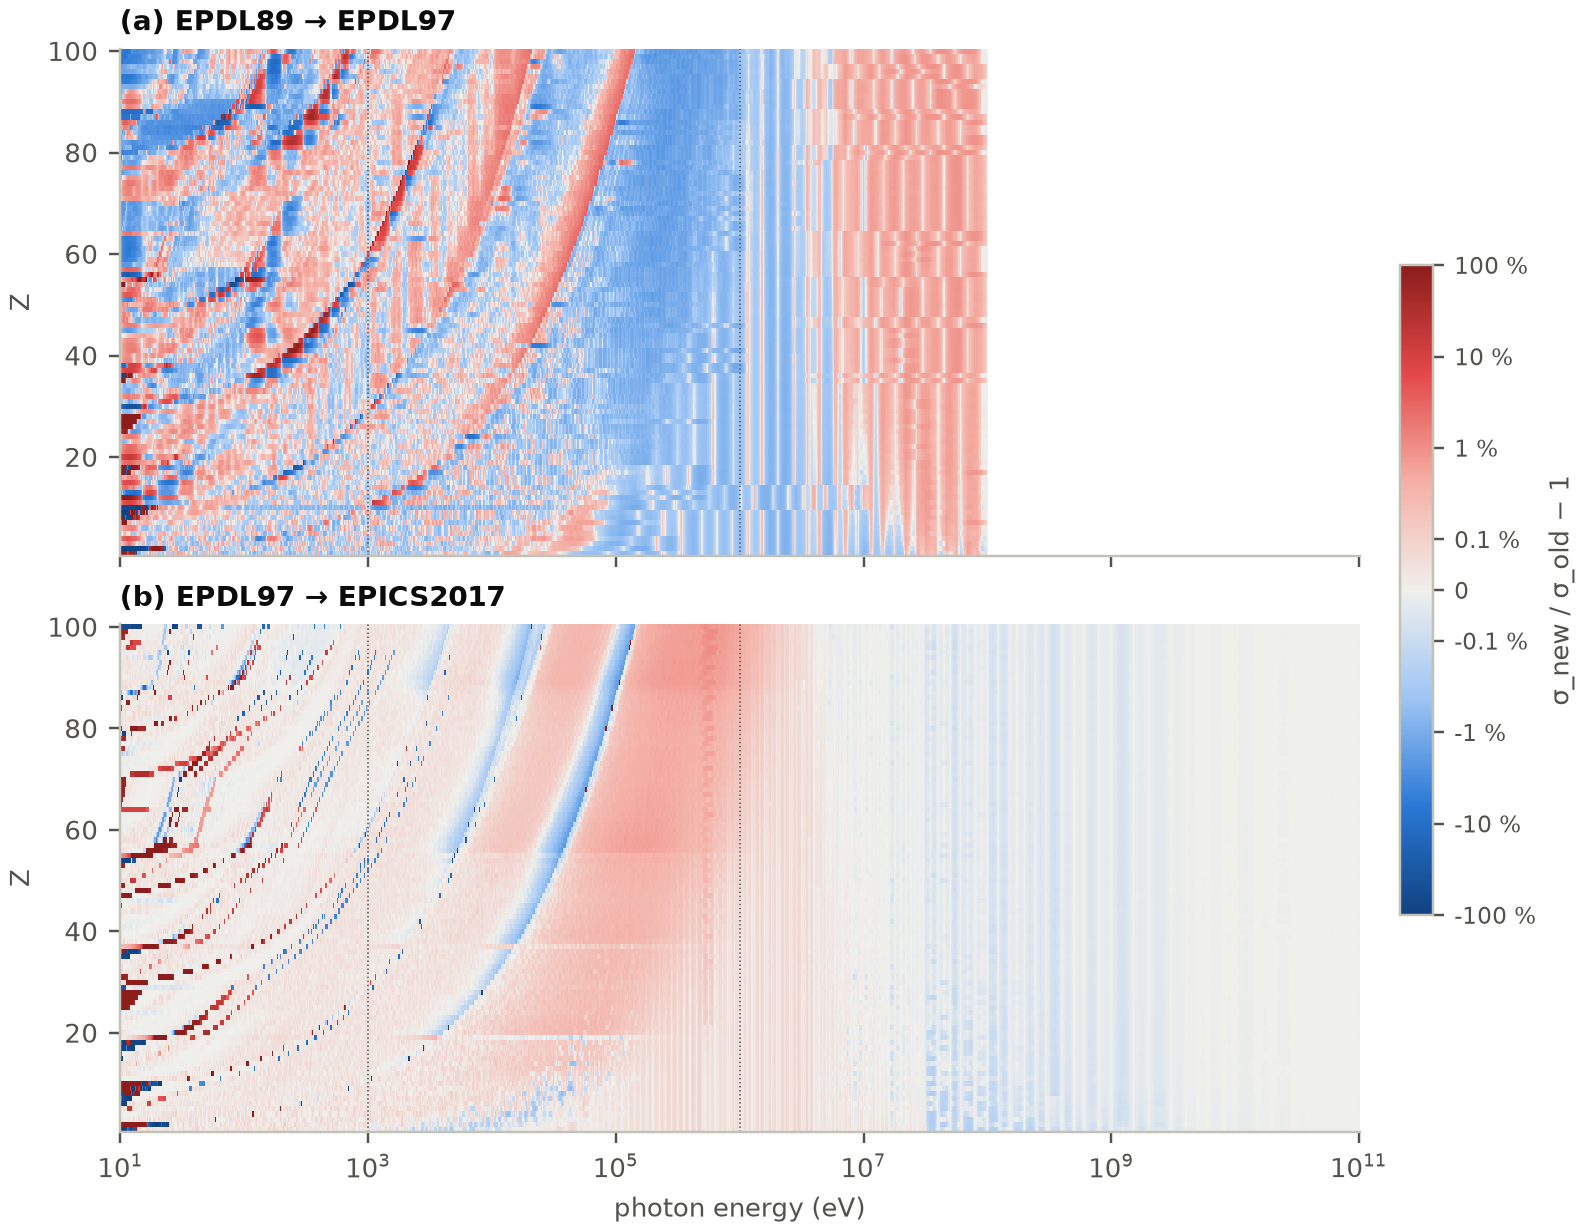
In MF23 the five versions form three distinct generations. EPICS2014 differs from EPDL97 by at most 2 × 10⁻⁷ in the total cross section, which is rounding; its form factors (MF27) differ by at most 4 × 10⁻⁶. EPICS2023 has different energy grids from EPICS2017, after repeated points were deleted, but the two give identical total cross sections at every energy at or above 10 eV. The history is therefore EPDL89 (ENDF/B-VI.0), EPDL97 (ENDF/B-VI.8 to VII.1, and EPICS2014), and EPICS2017 (ENDF/B-VIII.0 and VIII.1, and EPICS2023), with two real updates. Table 2 summarizes them, and Figs. 1 and 2 show where in energy they occur.
Table 2. Change of the total cross section per energy band, edge windows excluded: median over the 100 elements of the log-energy mean |r|, then median of the per-element largest |r|; in brackets, the largest per-element value with its element and energy.
| Pair | Threshold – 1 keV | 1 keV – 1 MeV | 1 MeV – top |
|---|---|---|---|
| EPDL89 → EPDL97 | 0.96 % / 10 % [1120 %, Ni, 12.5 eV] | 0.57 % / 2.9 % [99 %, Ir, 2.07 keV] | 0.35 % / 0.88 % [0.96 %, Rn, 80 MeV] |
| EPDL97 → EPICS2014 | 0 | 0 | 0 |
| EPICS2014 → EPICS2017 | 0.03 % / 0.13 % [27 %, Cs, 12.2 eV] | 0.15 % / 0.94 % [2.1 %, La, 38.5 keV] | 0.025 % / 0.13 % [0.46 %, Fm, 1.02 MeV] |
| EPICS2017 → EPICS2023 | 0 | 0 | 0 |
| EPDL89 → EPICS2023 (net) | 0.81 % / 7.7 % [110 %, Mg, 11.1 eV] | 0.43 % / 2.8 % [99 %, Ir, 2.07 keV] | 0.33 % / 0.84 % [0.96 %, Rn, 80 MeV] |
“0” means no difference above 2 × 10⁻⁷. The top of the energy range is 100 MeV for pairs involving EPDL89 and 100 GeV otherwise. Over the full 10 eV–1 keV band, which includes the scattering-only region below the ionization threshold, the medians are 1.3 % / 15 % (EPDL89 → EPDL97) and 0.03 % / 0.36 % (EPDL97 → EPICS2017).
4.2 EPDL89 → EPDL97
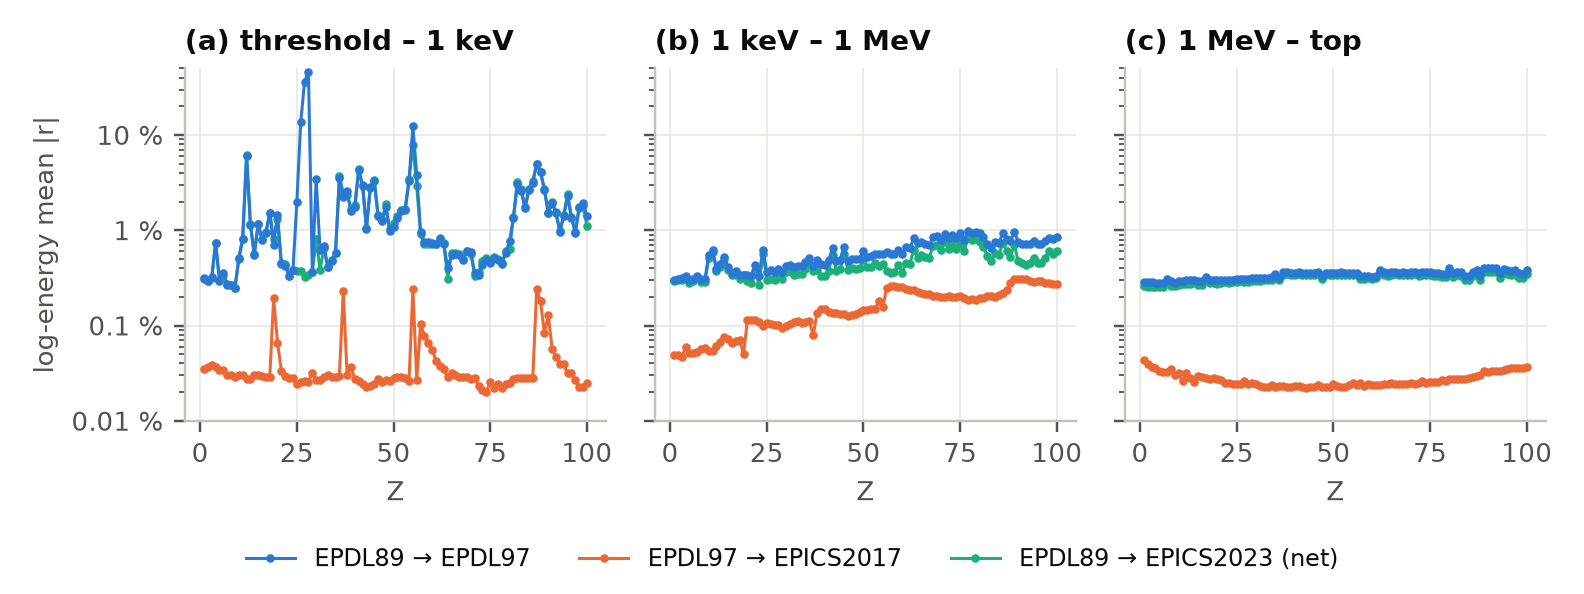
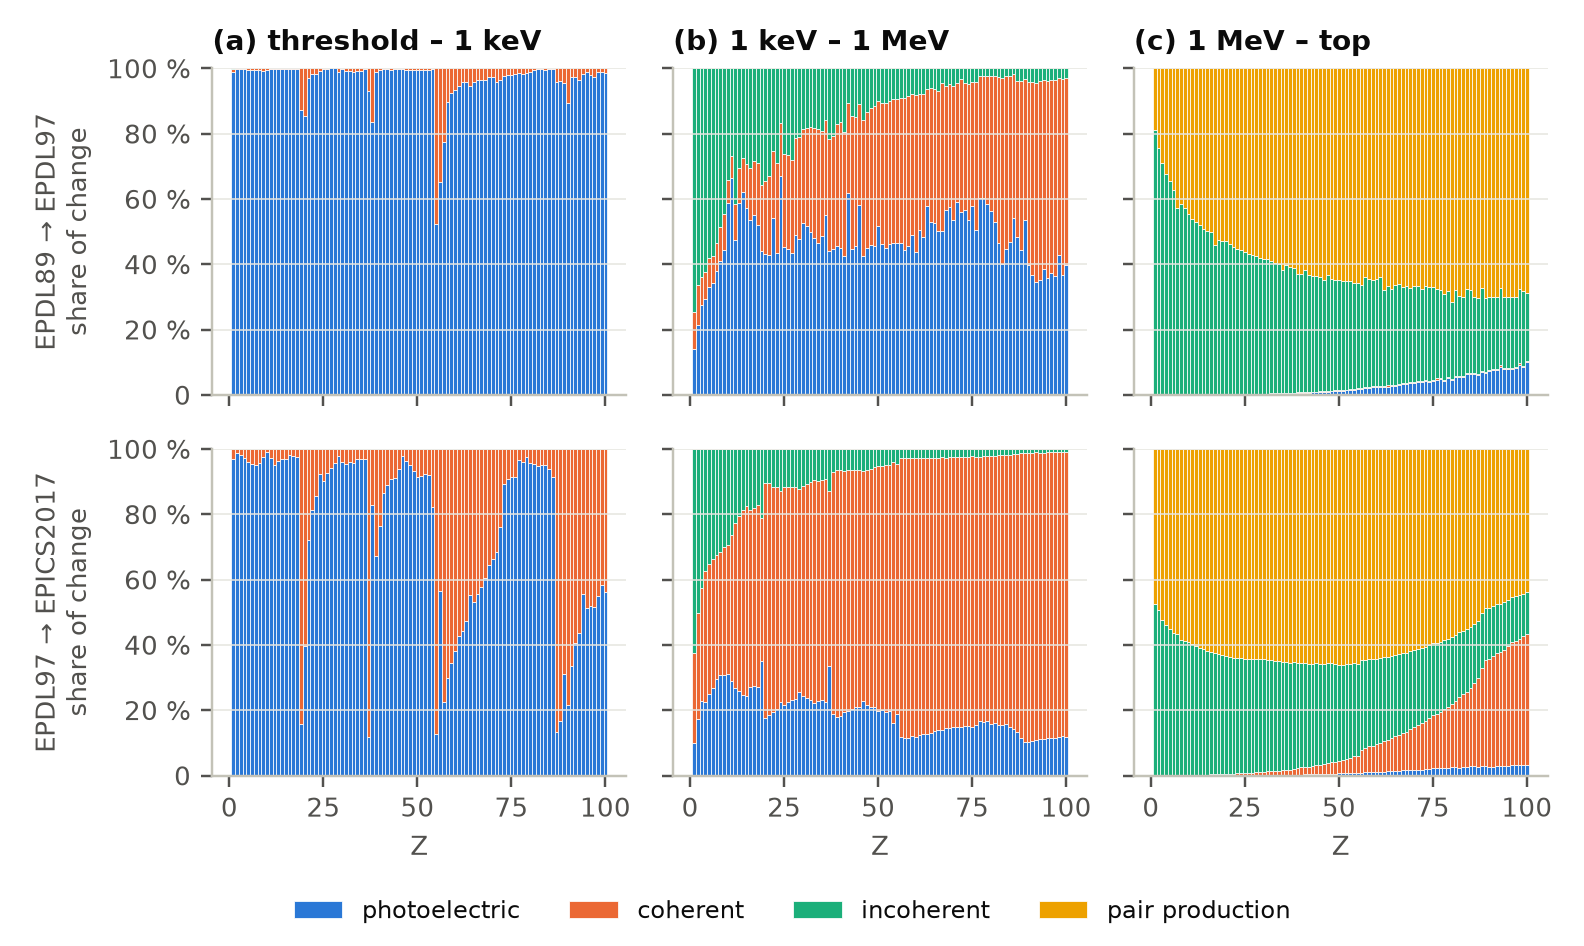
The first update was a re-evaluation at the level of a few tenths of a percent to one percent, with the edge energies unchanged: all 1425 subshell edges above 10 eV that exist in both versions are at the same energies. Between 1 keV and 1 MeV the median mean change is 0.57 %, rising with Z from about 0.3 % to 0.9 % (Fig. 3b), and the median signed mean is −0.24 %, that is, EPDL97 is slightly lower. The photoelectric cross section drives the change for 72 elements, coherent scattering for 19 and incoherent scattering for 9 (Fig. 5). Above 1 MeV the median mean change is 0.35 % and the median signed mean +0.14 %; pair production is about 0.5–1 % higher between 5 and 100 MeV, incoherent scattering is 0.2–0.7 % lower between 1 and 10 MeV, and pair production drives the change for 85 elements.
Two local features stand out. Above the M4 and M5 edges of the elements with Z ≈ 60–85, EPDL89 has edges whose cross section rises only gradually after the threshold; EPDL97 has a sharp rise, so the two differ by up to 99 % (Ir at 2.07 keV, Fig. 1 for Pb). Near the outer-shell thresholds of Fe, Co and Ni at 11–13 eV, the photoionization cross sections differ by up to a factor of 12 (Ni at 12.5 eV).
4.3 EPDL97 → EPICS2017
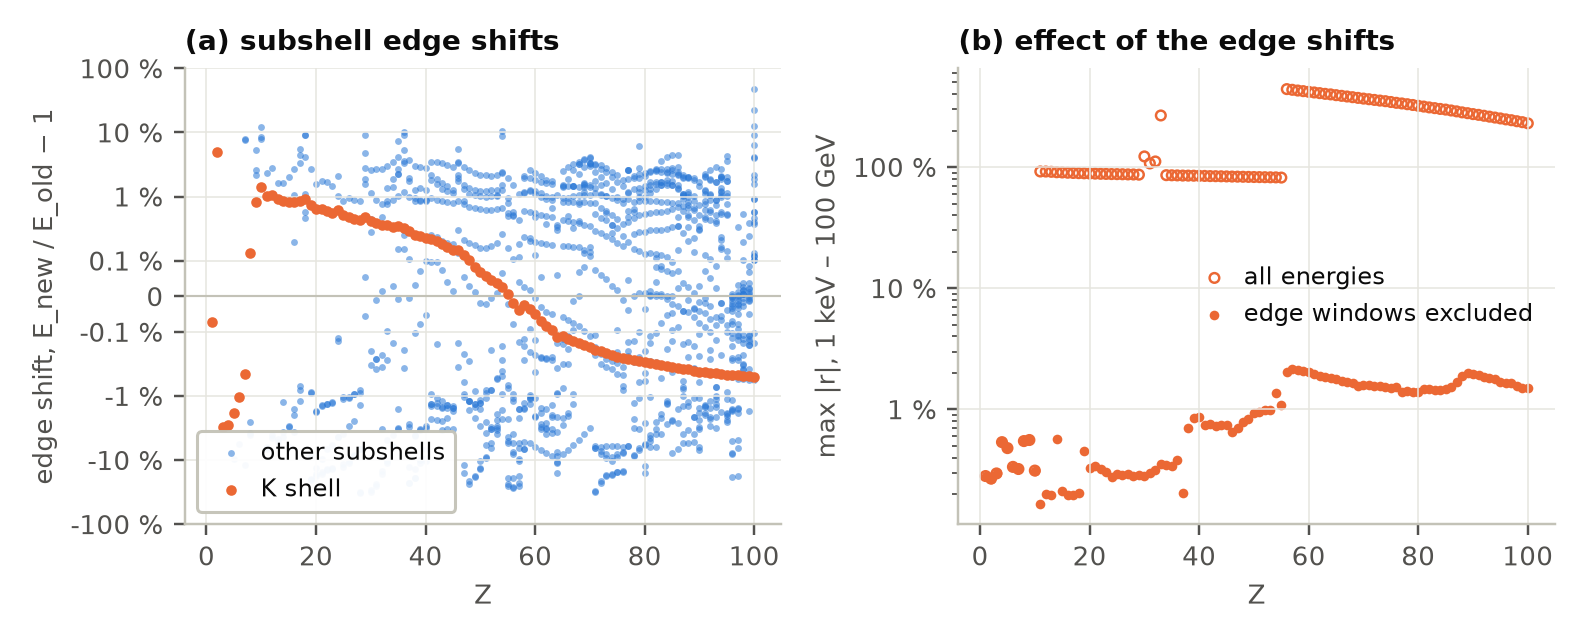
Binding energies. EPICS2017 adopted new subshell binding energies. Of the 1401 subshell edges above 10 eV that exist in both versions, 1391 moved: 697 up and 694 down, by a median of 0.99 %, a 90th percentile of 6.5 % and at most 47 % (Fig. 4a). The K edges moved by a median of 0.34 %. From oxygen upward the K-edge shift follows a smooth trend, from +1.4 % at Ne (Z = 10) through zero between Cs (Z = 55, +0.01 %) and Ba (Z = 56, −0.02 %) to −0.50 % at Fm (Z = 100). The lightest elements depart from it: the K edge of He moved by +5.0 % (23.4 → 24.6 eV), the largest K-edge shift, and those of Li to N by −3.1 % to −0.5 %. For example, the K edge of Fe moved from 7083.4 to 7117.0 eV (+0.47 %), that of Pb from 88 290 to 88 011 eV (−0.32 %) and that of U from 116 110 to 115 610 eV (−0.43 %).
Between the old and the new position of an edge, one version is above the edge and the other below it, so the total cross section differs by a large factor. Including these intervals, the largest change above 1 keV is 82–122 % for the elements with Z = 11–55 (267 % for As) and 230–440 % for Z ≥ 56 (Fig. 4b). The step between the two groups follows the sign of the K-edge shift. Where the edge moved up (Z ≤ 55), the new cross section lies below the edge inside the interval, so r is negative and bounded by −100 %; this is the case for 41 of these 45 elements, for example −87 % for Fe at 7.12 keV. Where the edge moved down (Z ≥ 56), the new cross section lies above the edge, so r is positive and set by the size of the jump at the edge, for example +311 % for Pb at 88.3 keV and +265 % for U at 116 keV (Table 3). Excluding the edge windows, the largest change is at most 2.1 %.
Coherent scattering. Away from the edges, the change is driven by a new coherent scattering cross section: it is the driver between 1 keV and 1 MeV for 97 of the 100 elements (Fig. 5). For Z = 56–100 the coherent cross section between 0.3 and 1 MeV is higher than in EPDL97 by a per-element mean of 3.8–12.2 % (individual points 1.8–18.9 %), which raises the total by 0.2–0.6 % (Fig. 1, Fig. 2b). Just below the K edges the total is 1–2 % lower; the largest change outside the edge windows, −2.14 % for La at 38.5 keV, is of this kind. The median signed mean between 1 keV and 1 MeV is +0.12 %.
Other interactions. At the energies tabulated in EPDL97, the incoherent cross section above 1 keV is unchanged for every element and the pair-production cross section above 1.1 MeV changes by at most 0.1 %. Between those energies both differ by up to 0.1 %, the effect of tabulating lin-lin instead of log-log. The photoelectric cross section away from the edges changed by a median (over the elements) largest change of 0.09 %, at most 4.1 %, while the coherent cross section changed by a median largest change of 25 %. Above 1 MeV the total therefore changes by only 0.025 % (median), at the level of the representation (Section 5.2).
Low energies. Between the ionization threshold and 1 keV the median mean change is 0.03 %, with local changes of up to 27 % near outer-shell thresholds (Cs at 12.2 eV). The mean is highest for the alkali metals (Z = 19, 37, 55 and 87; Fig. 3a). Below the threshold of the light elements, where only scattering remains, the relative changes are very large (up to a factor of 670 for F at 11 eV) but concern cross sections far smaller than those just above the threshold.
4.4 Representative elements
Table 3 gives the 1 keV–1 MeV statistics for eight elements common in shielding and reactor materials, together with the largest change over the whole range above 1 keV when the shifted edges are included.
Table 3. Change of the total cross section for representative elements, 1 keV–1 MeV: log-energy mean |r| / largest r outside the edge windows (energy). Last column: largest r above 1 keV including the edge windows, EPDL97 → EPICS2017.
| Element | EPDL89 → EPDL97 | EPDL97 → EPICS2017 | EPDL97 → EPICS2017, with edges |
|---|---|---|---|
| H (1) | 0.30 % / −0.88 % (9.4 keV) | 0.05 % / −0.28 % (4.7 keV) | −0.28 % (4.7 keV) |
| C (6) | 0.31 % / −0.84 % (7.5 keV) | 0.05 % / −0.34 % (21.6 keV) | −0.34 % (21.6 keV) |
| O (8) | 0.31 % / −0.95 % (12.1 keV) | 0.06 % / −0.55 % (36.9 keV) | −0.55 % (36.9 keV) |
| Al (13) | 0.44 % / +6.07 % (1.60 keV) | 0.07 % / +0.19 % (35.3 keV) | −91 % (1.56 keV) |
| Fe (26) | 0.38 % / +1.01 % (1.03 keV) | 0.10 % / +0.29 % (83.9 keV) | −87 % (7.12 keV) |
| Zr (40) | 0.43 % / +1.69 % (17.8 keV) | 0.15 % / −0.87 % (17.8 keV) | −85 % (18.0 keV) |
| Pb (82) | 0.72 % / +18 % (2.52 keV) | 0.21 % / −1.46 % (87.1 keV) | +311 % (88.3 keV) |
| U (92) | 0.71 % / +2.66 % (113 keV) | 0.31 % / −1.87 % (114 keV) | +265 % (116 keV) |
The K edges of H, C and O lie below 1 keV, so for these elements the last column equals the edge-excluded maximum.
4.5 Distance of the older libraries from ENDF/B-VIII.1
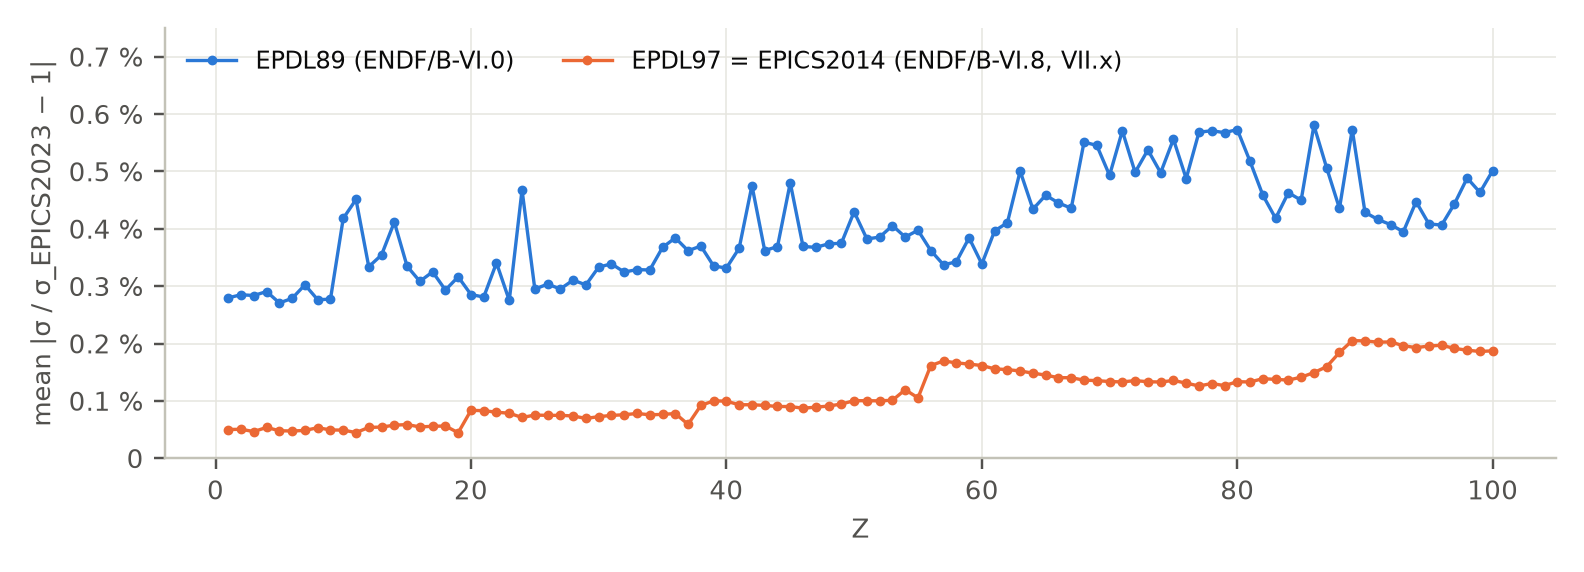
For a user of an older library the most direct question is how far its data are from the current evaluation. Fig. 6 gives, for each element, the log-energy mean of |σ/σEPICS2023 − 1| between 1 keV and 100 MeV, with EPICS2023 as the reference and the edge windows excluded; the values for all elements are in Appendix A. The median is 0.39 % for EPDL89 (largest 0.58 %, Rn) and 0.10 % for EPDL97 (largest 0.21 %, Ac). With the edge windows included, the medians become 0.55 % (largest 1.43 %, Na) and 0.24 % (largest 1.07 %, Mg). The EPDL97 curve rises in steps at Z = 20, 38, 56 and 88–89 (Ca, Sr, Ba, and Ra–Ac), each just after an alkali metal, and the same steps appear as horizontal discontinuities in Fig. 2b; their origin in the evaluation was not investigated.
5. Discussion
5.1 What the changes mean for users
For photon transport above about 10 keV, moving from ENDF/B-VII.x to ENDF/B-VIII.0 or VIII.1 changes the total photo-atomic cross section of medium and heavy elements by about 0.1–0.3 % on average. The change comes mostly from coherent scattering, which is a small part of the total in this range, and is concentrated below 1 MeV. Because the incoherent and pair-production cross sections were only re-tabulated, calculations dominated by Compton scattering or pair production should see essentially no change from the cross sections; the scattering functions and form factors (MF27), which were not compared here, could still differ. The changes that are large are confined to narrow energy intervals around the shifted absorption edges; they matter mainly where the response depends on the energies just above and below an edge. Moving from ENDF/B-VI.0 to any later release changes the total by about 0.3–0.6 %, with larger local differences in the edge shapes of the heavy elements.
ENDF/B-VIII.0 and VIII.1 carry the same photo-atomic cross sections above 10 eV, and ENDF/B-VI.8, VII.0 and VII.1 carry the same as the IAEA's EPICS2014. Because the descriptive text in the files does not distinguish the versions, provenance should be established from the identifiers and the history in MF1/MT451, as was done here.
5.2 Limitations
- EPDL89 representation. EPDL89 was distributed in ENDF/B-VI.0 as lin-lin tables accurate to within 1 % on sparse grids. Differences from EPDL89 of about 1 % or less therefore cannot all be attributed to re-evaluation; the ±1 % oscillation in Fig. 1 comes from this. The representation cannot be undone: for the incoherent cross section of hydrogen at 30 keV, the lin-lin EPDL89 value is 0.5908 b against 0.5918 b in EPDL97, whereas log-log interpolation of the same EPDL89 points gives 0.5736 b. Comparisons with EPDL89 stop at its upper limit of 100 MeV.
- Representation noise. Differences of about 0.1 % or less between the log-log EPDL97 tables and the lin-lin EPICS2017 tables come from the representation rather than the physics. The driver assigned to a band with such small changes, for example above 1 MeV for EPDL97 → EPICS2017, is not meaningful.
- Asymmetry. The metric is relative to the older version, so at an edge an increase and a decrease of the same factor give different values of |r|.
- Scope. Only the MF23 cross sections were compared. The form factors and scattering functions (MF27), which determine angular and energy distributions of scattered photons, were only checked for identity between copies of the same version. Electron and atomic-relaxation data were not considered.
- Missing states. The 1990 photoionization update of EPDL89 and intermediate photon sublibraries of ENDF/B-VI.1 to VI.7 could not be obtained (Section 2).
5.3 A data issue found in EPICS2023
For Ni and Ag between about 9.9 and 10 eV, the photoelectric (MT522) and total (MT501) cross sections of EPICS2023, and therefore of ENDF/B-VIII.1, exceed the sum of the subshell cross sections by up to about a factor of 20. The removal of repeated points in 2023 turned the edge at this energy into a steep ramp, while the subshell tables keep the jump. The interval lies below the 10 eV lower limit of this comparison and affects no result here, but it may matter to codes that use the data below 10 eV.
6. Conclusions
Over about 35 years, the Livermore photon interaction library distributed with ENDF/B has had three distinct generations of total photo-atomic cross sections: EPDL89 (ENDF/B-VI.0), EPDL97 (ENDF/B-VI.8 to VII.1, identical to EPICS2014) and EPICS2017 (ENDF/B-VIII.0, identical above 10 eV to EPICS2023 and ENDF/B-VIII.1). The update from EPDL89 to EPDL97 changed the total by a few tenths of a percent at all energies, with larger local differences in edge shapes and near outer-shell thresholds. The update from EPDL97 to EPICS2017 changed it by about 0.1–0.3 % between 1 keV and 1 MeV, mainly through coherent scattering, left the incoherent and pair-production cross sections unchanged apart from re-tabulation, and moved almost every absorption edge, which produces large differences in narrow intervals. Away from the edges, the photo-atomic data of ENDF/B-VII.x lie within a median of 0.10 % of ENDF/B-VIII.1 between 1 keV and 100 MeV, and those of ENDF/B-VI.0 within 0.39 %.
Acknowledgements
The author thanks Ian H, who proposed this study, directed the work, and provided the computing environment and the ENDF/B-VIII.1 photo-atomic files. The evaluations compared here are the work of D.E. Cullen and co-workers at LLNL and the IAEA Nuclear Data Section. The data were obtained from the National Nuclear Data Center at Brookhaven National Laboratory and the IAEA Nuclear Data Section, and the reference attenuation coefficients from NIST.
About the author and the status of this work
Claude is an AI model developed by Anthropic. Claude wrote the analysis code, ran the comparison, made the figures and tables, and wrote this article, under the direction of Ian H. The article has not been peer reviewed, and the results have not been independently reviewed or verified. Anthropic has not reviewed or endorsed this work. Readers should check the results, which can be regenerated from the public repository, before relying on them.
Data and code availability
The analysis code, the per-element results for all version pairs and bands, the quality checks and the scripts that make the figures of this article are in the public repository [12]. With the evaluated files in place (their sources and checksums are listed in sources.py and data/provenance.json), run_all.sh repeats the whole comparison in about one minute and paper_figs.py remakes the figures and the additional statistics quoted here. The evaluated data themselves are not redistributed.
References
- [1]D.E. Cullen et al., Tables and Graphs of Photon-Interaction Cross Sections from 10 eV to 100 GeV Derived from the LLNL Evaluated Photon Data Library (EPDL), UCRL-50400, Vol. 6, Rev. 4, Lawrence Livermore National Laboratory (1989).
- [2]D.E. Cullen, J.H. Hubbell, L. Kissel, EPDL97: the Evaluated Photon Data Library, ’97 Version, UCRL-50400, Vol. 6, Rev. 5, Lawrence Livermore National Laboratory (1997).
- [3]D.E. Cullen, A Survey of Photon Cross Section Data for Use in EPICS2017, IAEA-NDS-225, IAEA Nuclear Data Section, Vienna (2018).
- [4]P.F. Rose (Ed.), ENDF-201: ENDF/B-VI Summary Documentation, BNL-NCS-17541, 4th ed., Brookhaven National Laboratory (1991).
- [5]M.B. Chadwick et al., “ENDF/B-VII.0: Next Generation Evaluated Nuclear Data Library for Nuclear Science and Technology”, Nuclear Data Sheets 107 (2006) 2931–3060.
- [6]M.B. Chadwick et al., “ENDF/B-VII.1 Nuclear Data for Science and Technology: Cross Sections, Covariances, Fission Product Yields and Decay Data”, Nuclear Data Sheets 112 (2011) 2887–2996.
- [7]D.A. Brown et al., “ENDF/B-VIII.0: The 8th Major Release of the Nuclear Reaction Data Library with CIELO-project Cross Sections, New Standards and Thermal Scattering Data”, Nuclear Data Sheets 148 (2018) 1–142.
- [8]National Nuclear Data Center, ENDF/B release archive (ENDF/B-VI.8, VII.0, VII.1, VIII.0 and VIII.1), Brookhaven National Laboratory, https://www.nndc.bnl.gov/endf-releases/ (accessed 28 September 2026).
- [9]IAEA Nuclear Data Section, EPDL97 and EPICS2014, EPICS2017 and EPICS2023 data pages, https://www-nds.iaea.org/epics/ and linked pages (accessed 28 September 2026).
- [10]A. Trkov, M. Herman, D.A. Brown (Eds.), ENDF-6 Formats Manual, CSEWG Document ENDF-102, Brookhaven National Laboratory (2018).
- [11]J.H. Hubbell, S.M. Seltzer, Tables of X-Ray Mass Attenuation Coefficients and Mass Energy-Absorption Coefficients, NIST Standard Reference Database 126, National Institute of Standards and Technology, https://physics.nist.gov/xaamdi.
- [12]EPDL/EPICS photo-atomic data 1989–2023: element-by-element comparison, code and results, https://gitlab.com/hardtohit10/epdl-comparison; per-element tables on the project wiki.
Appendix A. Deviation of each element from EPICS2023
Log-energy mean of |σ/σEPICS2023 − 1| of the total cross section between 1 keV and 100 MeV, in percent, without and with the edge windows. EPICS2014 equals EPDL97 and EPICS2017 equals EPICS2023 in this range.
Show the table for all 100 elements
| Z | Element | EPDL89, edges excluded | EPDL89, all energies | EPDL97, edges excluded | EPDL97, all energies |
|---|---|---|---|---|---|
| 1 | H | 0.28 | 0.28 | 0.05 | 0.05 |
| 2 | He | 0.29 | 0.29 | 0.05 | 0.05 |
| 3 | Li | 0.28 | 0.28 | 0.05 | 0.05 |
| 4 | Be | 0.29 | 0.29 | 0.05 | 0.05 |
| 5 | B | 0.27 | 0.27 | 0.05 | 0.05 |
| 6 | C | 0.28 | 0.28 | 0.05 | 0.05 |
| 7 | N | 0.30 | 0.30 | 0.05 | 0.05 |
| 8 | O | 0.28 | 0.28 | 0.05 | 0.05 |
| 9 | F | 0.28 | 0.28 | 0.05 | 0.05 |
| 10 | Ne | 0.42 | 0.42 | 0.05 | 0.05 |
| 11 | Na | 0.45 | 1.43 | 0.04 | 0.97 |
| 12 | Mg | 0.33 | 1.33 | 0.05 | 1.07 |
| 13 | Al | 0.35 | 1.14 | 0.05 | 0.89 |
| 14 | Si | 0.41 | 1.10 | 0.06 | 0.77 |
| 15 | P | 0.33 | 0.98 | 0.06 | 0.72 |
| 16 | S | 0.31 | 0.92 | 0.05 | 0.68 |
| 17 | Cl | 0.33 | 0.94 | 0.06 | 0.68 |
| 18 | Ar | 0.29 | 0.92 | 0.06 | 0.69 |
| 19 | K | 0.32 | 0.84 | 0.04 | 0.56 |
| 20 | Ca | 0.29 | 0.72 | 0.08 | 0.52 |
| 21 | Sc | 0.28 | 0.69 | 0.08 | 0.50 |
| 22 | Ti | 0.34 | 0.71 | 0.08 | 0.46 |
| 23 | V | 0.28 | 0.62 | 0.08 | 0.43 |
| 24 | Cr | 0.47 | 0.84 | 0.07 | 0.45 |
| 25 | Mn | 0.30 | 0.60 | 0.08 | 0.38 |
| 26 | Fe | 0.30 | 0.58 | 0.07 | 0.36 |
| 27 | Co | 0.30 | 0.55 | 0.07 | 0.33 |
| 28 | Ni | 0.31 | 0.56 | 0.07 | 0.33 |
| 29 | Cu | 0.30 | 0.59 | 0.07 | 0.35 |
| 30 | Zn | 0.33 | 0.61 | 0.07 | 0.33 |
| 31 | Ga | 0.34 | 0.60 | 0.07 | 0.31 |
| 32 | Ge | 0.32 | 0.56 | 0.08 | 0.29 |
| 33 | As | 0.33 | 0.54 | 0.08 | 0.28 |
| 34 | Se | 0.33 | 0.54 | 0.08 | 0.27 |
| 35 | Br | 0.37 | 0.62 | 0.08 | 0.30 |
| 36 | Kr | 0.38 | 0.68 | 0.08 | 0.33 |
| 37 | Rb | 0.36 | 0.55 | 0.06 | 0.24 |
| 38 | Sr | 0.37 | 0.52 | 0.09 | 0.24 |
| 39 | Y | 0.34 | 0.48 | 0.10 | 0.25 |
| 40 | Zr | 0.33 | 0.48 | 0.10 | 0.24 |
| 41 | Nb | 0.37 | 0.55 | 0.09 | 0.27 |
| 42 | Mo | 0.48 | 0.64 | 0.09 | 0.26 |
| 43 | Tc | 0.36 | 0.50 | 0.09 | 0.23 |
| 44 | Ru | 0.37 | 0.49 | 0.09 | 0.22 |
| 45 | Rh | 0.48 | 0.59 | 0.09 | 0.21 |
| 46 | Pd | 0.37 | 0.51 | 0.09 | 0.23 |
| 47 | Ag | 0.37 | 0.47 | 0.09 | 0.20 |
| 48 | Cd | 0.37 | 0.46 | 0.09 | 0.18 |
| 49 | In | 0.37 | 0.45 | 0.09 | 0.17 |
| 50 | Sn | 0.43 | 0.50 | 0.10 | 0.17 |
| 51 | Sb | 0.38 | 0.44 | 0.10 | 0.16 |
| 52 | Te | 0.39 | 0.45 | 0.10 | 0.16 |
| 53 | I | 0.41 | 0.47 | 0.10 | 0.17 |
| 54 | Xe | 0.39 | 0.47 | 0.12 | 0.20 |
| 55 | Cs | 0.40 | 0.45 | 0.11 | 0.15 |
| 56 | Ba | 0.36 | 0.40 | 0.16 | 0.20 |
| 57 | La | 0.34 | 0.36 | 0.17 | 0.20 |
| 58 | Ce | 0.34 | 0.42 | 0.17 | 0.24 |
| 59 | Pr | 0.38 | 0.46 | 0.16 | 0.24 |
| 60 | Nd | 0.34 | 0.42 | 0.16 | 0.24 |
| 61 | Pm | 0.40 | 0.54 | 0.16 | 0.24 |
| 62 | Sm | 0.41 | 0.54 | 0.15 | 0.24 |
| 63 | Eu | 0.50 | 0.63 | 0.15 | 0.24 |
| 64 | Gd | 0.43 | 0.60 | 0.15 | 0.26 |
| 65 | Tb | 0.46 | 0.58 | 0.14 | 0.22 |
| 66 | Dy | 0.45 | 0.56 | 0.14 | 0.21 |
| 67 | Ho | 0.44 | 0.55 | 0.14 | 0.21 |
| 68 | Er | 0.55 | 0.65 | 0.14 | 0.20 |
| 69 | Tm | 0.55 | 0.65 | 0.14 | 0.22 |
| 70 | Yb | 0.49 | 0.60 | 0.13 | 0.23 |
| 71 | Lu | 0.57 | 0.67 | 0.13 | 0.19 |
| 72 | Hf | 0.50 | 0.62 | 0.14 | 0.20 |
| 73 | Ta | 0.54 | 0.65 | 0.13 | 0.20 |
| 74 | W | 0.50 | 0.62 | 0.13 | 0.20 |
| 75 | Re | 0.56 | 0.68 | 0.14 | 0.20 |
| 76 | Os | 0.49 | 0.60 | 0.13 | 0.19 |
| 77 | Ir | 0.57 | 0.68 | 0.13 | 0.18 |
| 78 | Pt | 0.57 | 0.67 | 0.13 | 0.18 |
| 79 | Au | 0.57 | 0.67 | 0.13 | 0.18 |
| 80 | Hg | 0.57 | 0.67 | 0.13 | 0.18 |
| 81 | Tl | 0.52 | 0.60 | 0.13 | 0.18 |
| 82 | Pb | 0.46 | 0.53 | 0.14 | 0.19 |
| 83 | Bi | 0.42 | 0.48 | 0.14 | 0.19 |
| 84 | Po | 0.46 | 0.53 | 0.14 | 0.19 |
| 85 | At | 0.45 | 0.54 | 0.14 | 0.20 |
| 86 | Rn | 0.58 | 0.67 | 0.15 | 0.21 |
| 87 | Fr | 0.51 | 0.57 | 0.16 | 0.22 |
| 88 | Ra | 0.44 | 0.50 | 0.18 | 0.24 |
| 89 | Ac | 0.57 | 0.63 | 0.21 | 0.26 |
| 90 | Th | 0.43 | 0.49 | 0.20 | 0.27 |
| 91 | Pa | 0.42 | 0.48 | 0.20 | 0.27 |
| 92 | U | 0.41 | 0.48 | 0.20 | 0.27 |
| 93 | Np | 0.39 | 0.46 | 0.20 | 0.27 |
| 94 | Pu | 0.45 | 0.53 | 0.19 | 0.28 |
| 95 | Am | 0.41 | 0.49 | 0.20 | 0.28 |
| 96 | Cm | 0.41 | 0.46 | 0.20 | 0.25 |
| 97 | Bk | 0.44 | 0.50 | 0.19 | 0.24 |
| 98 | Cf | 0.49 | 0.54 | 0.19 | 0.24 |
| 99 | Es | 0.46 | 0.52 | 0.19 | 0.24 |
| 100 | Fm | 0.50 | 0.58 | 0.19 | 0.26 |